Submitted as part of coursework in my Master’s degree in Global Public Health
Evaluating Quantitative Research in Global Health: Strengths, Weaknesses, and Opportunities for Improvement.
Quantitative research is the collection and analysis of primarily numerical data in order to identify patterns, test hypotheses, and aspires to establish generalisable principles in an objective manner (Bryman, 2016). Quantitative approaches are associated with a positivist paradigm that asserts that phenomena can be measured objectively, understood and predicted through observable data (Park et al, 2020), and are typically applied in global health research through utilising structured methods such as surveys, questionnaires and experiments. The resultant data is then analysed using statistical methods to infer and establish correlations amongst the measured variables. Quantitative methods aim to provide precise, quantifiable results that may be generalised to wider contexts and repeated by other researchers (Merson et al, 2012).
It is useful to explore quantitative research in contrast with qualitative. While quantitative research focuses on numerical data, qualitative research aims to understand and interpret social phenomena by using non-numerical data such as words, images, and understanding. This involves methods including interviews, focus groups, and observations, which attempt to enable researchers to see through others’ perspectives. Unlike quantitative research, qualitative research does not aim to generalise findings, but instead aims to provide detailed and rich insights into specific contexts.
Quantitative approaches tend to be deductive; beginning with a hypothesis that may be proven or disproven. Qualitative research in contrast is often inductive – allowing the researcher to explore rich sources of information and develop insights or theories. The epistemological distinction between the positivist, quantitative approach and the more sociological, phenomenological, qualitative approach describes the different methods and their aims, however, the two approaches are regarded by many researchers as incompatible means for knowledge construction (Teddlie & Tashakkori, 2003). Some academics, practitioners and policymakers see qualitative research as weaker in validity than quantitative approaches, though others in the field of global health argue that qualitative approaches should be seen as an indicator reliable enough to begin effective health promotion interventions (Trautmann & Burrows, 1999). Increasingly, global health researchers combine both approaches in mixed methods research designs which allow them to utilise the benefits of each approach whilst mitigating their weaknesses (Merson et al, 2012).
In 2013, an Ebola Virus Disease (EVD) outbreak that began in Guinea spread quickly to the bordering countries of Liberia and Sierra Leone. On March 23, 2014 the WHO declared an outbreak of EVD and by July 2014 it was considered a global health crisis (McInnes, 2016). Poor surveillance systems and public health infrastructure contributed to the rapid spread of the disease. A year later, in March 2015, EVD cases in Sierra Leona continued to rise (Brooks, 2015),
Researchers Park et al. conducted a comparative analysis of sequences from 673 patients in Sierra Leone between December 2014 and May 2015, along with genomes from 88 patients during the earlier phase of the epidemic. The aim was to discern the transmission patterns of the virus within the country and identify potential cases resulting from cross-border movements (Park et al, 2015). This quantitative research spanned seven months from initial genome sequencing to completed data analysis. It provided compelling evidence that EVD transmission was predominantly within the country rather than from outside Sierra Leone. The findings from this paper provided decision makers with a solid rationale for restricting movement to reduce the spread of EVD.
However, it provided little insight into how those restrictions could be applied in a culturally sensitive and context-appropriate manner that would maximise compliance with movement restrictions. Over 9,430 new EVD cases in Sierra Leona were reported over the trial period from December 2014 to May 2015, causing around 6000 deaths, according to 2017 CDC data (CDC, 2017). The transmission of EVD is generally via bodily fluids such as blood, faeces and vomit, and death is usually a result of haemorrhaging through orifices and the skin itself, which renders the bodies of EVD victims highly infectious. Sierra Leonean funeral traditions include washing the corpse by hand before burial as well as touching the corpse during the ceremony (Richards et al., 2015). Knowing this, it was important to gain a contextual understanding of that behaviour, and how it might be changed in culturally and interpersonally sensitive ways, in order to promote safe burial practice that reduced transmission of EVD. A Rapid Qualitative Assessment using focus group discussions was conducted in 2014 to explore community attitudes, knowledge and practices regarding burials (Lee-Kwan et al, 2017). The research focussed on seven chiefdoms in Bo District, Sierra Leone over the week of October 20, 2014, and identified cultural barriers to clinically safe burial practices. These insights were then used to guide emergency response teams and shared with aid workers and humanitarian agencies within the month, enabling them to have impactful dialogue with affected communities and implement culturally appropriate changes toward safer burial practices that slowed the spread of the disease.
Here, we can see that a quantitative approach was crucial in proving the theory that EVD was transmitted within populations, and it provided a strong rationale for a policy-based response by Sierra Leonean authorities. However, it was a qualitative approach that facilitated quick and contextually appropriate change in affected communities and rapidly reduced the spread of EVD.
Quantitative approaches can provide means to accurately identify populations for research and aid, as in the case of the Nepalese earthquake in 2015. Wilson et al (2016) utilised cell phone tower data in Nepal to rapidly identify displacement as a result of the earthquake. By comparing cell tower connection data from before and after the earthquake, and correlating this with seismic data, researchers located vulnerable communities and identified populations that were displaced. This data was invaluable in directing and triangulating aid as well as further qualitative studies on the impact of the earthquake (Yabe et al, 2020).
Whilst the use of cell tower data was a rapid way of directing aid to displaced populations, as with all quantitative research, the data may not tell the whole story. Not everyone in Nepal owned a mobile phone: this data was a proxy for the presence of people, and may not reflect the actual density or size of populations. Additionally, akin to The Streetlight Effect (see figure 1) – a drunk man searches for his keys under the streetlight not because that’s where he lost his keys but because that’s where the light is brightest (Fisher, 1942) – it’s critical to distinguish areas where there was no cell tower from areas where there are no people. As a result of these two effects, aid and research may have been directed not to where the need was greatest, but to where mobile phone ownership was highest.
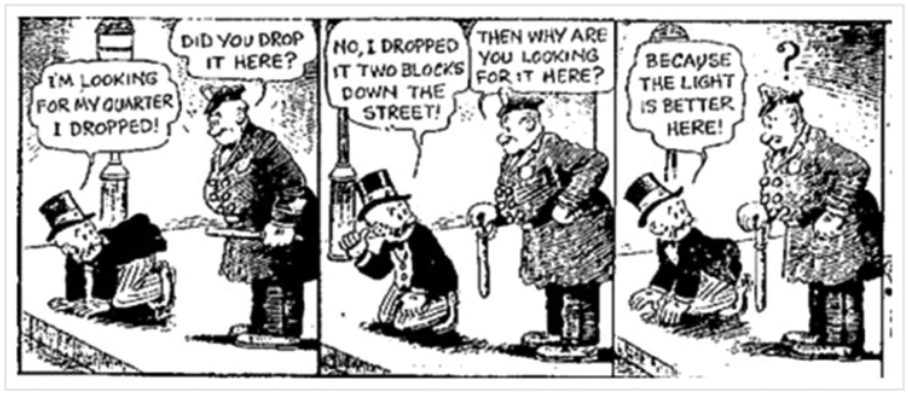
Figure 1: The Streetlight Effect: June 1942, a comic strip called Mutt & Jeff, by B Fisher.
Quantitative research typically demonstrates generalisability across different contexts to the original study. Both previously mentioned studies demonstrate generalisability, however, as shown, quantitative research often lacks depth and context. In the field of global health, the results of quantitative research may tell us that a decision or action needs to be taken, but not how to do it. In this respect, qualitative approaches can provide rapid and actionable insights. Qualitative research methods have an unrivalled capacity to constitute compelling arguments about how things work in particular contexts (Mason, 2002). They allow us to “explore the perspectives, experiences, relationships and decision-making processes of human actors within health systems, and in so doing, help uncover and explain the impact of vital but difficult-to-measure issues such as power, culture and norms” (Topp et al, 2018, p. 2).
One of the strengths of quantitative research is it is considered to be objective, and thus, more reliable as a foundation for decision making. Numerical data is perceived as the “exclusion of judgement, the struggle against subjectivity” (Porter, 1997, p.ix), and numbers are regarded as hard – thus a safer bet for those making business or policy decisions (Muller, 2018). Qualitative data, partly as a result of its low generalisability but also in its perception as being soft in comparison to quantitative data, is sometimes considered less robust as a rationale for important decisions. However, research has shown that quantitative data is actually less effective than qualitative data in persistently changing attitudes (Kazoleas, 1993). Whilst quantitative data may lend itself to justifying policy and business decisions with confidence, it is qualitative data that is necessary to win over hearts and minds in the long term.
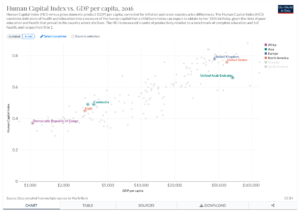
Quantitative data can also lend itself well to visualisation. Data visualisation represents any representation of information designed to enable communication, analysis, discovery, or exploration (Cairo, 2016). However, “…it is important for creators and readers of these depictions to remember that they are not ‘data’ but readings, interpretations of data meditated by programmed algorithms and hermeneutic desires.” (Wulfman, 2014, p94). That is to say, data visualisations can be as misleading as they can be enlightening. As Rosemary Hill points out, “…data is often reified as objective, by showing how the rhetoric of objectivity within data visualisation conventions is harnessed to do work in the world that is potentially very damaging to women’s rights” (Hill, 2017, p.83). Hill showed that anti-abortion groups were more likely to utilise data visualisation than pro-choice groups, which worked to ostensibly simplify the issue and “mobilise the rhetoric of neutrality” (Ibid, p.83). Data visualisations can frame issues in persuasive ways, potentially leading to overconfident impressions of causality and prioritising values such as scientific objectivity over others. These aspects can influence audiences’ thoughts and actions on important issues, and may contribute to misinformation or misrepresentation (Nash, Trott and Allen, 2022), leading to adverse impacts on public health such as restriction of access to abortion services as highlighted by Hill (2017).
One of quantitative data’s most powerful strengths is the ability to identify trends and patterns over time. An impactful application of this is Statistical Process Control (SPC), a practice spawned at Bell Laboratories in 1920 by Walter Shewhart, which is only now beginning to shape global health research. Shewhart brought together the disciplines of statistics, engineering, and economics and became known as the father of modern quality control (ASQ, 2000). Shewhart measured the quality output of manufacturing processes and mapped this data onto an SPC chart over time, an example of which is shown below. Through this, trends and anomalies can be identified (Seland, 2021). SPC detects changes in a process over time: a trend up or down indicates a cause “common” to the process, whilst an anomaly indicates a “special” cause – one that is not common to the process, such as a power outage or equipment failure. In most applications of SPC, anything within three sigmas (one sigma is one standard deviation) of the mean is considered to be a common cause, whilst anything outside that range is considered a special cause.
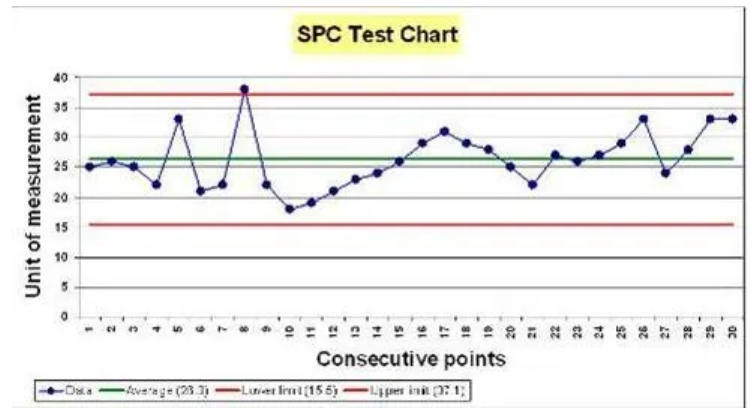
Figure 2: An example SPC Chart showing a trend upwards (common cause) and a spike above three sigmas (special cause). Source: WEAHN.
SPC charts revolutionised quality in industry, and have become increasingly utilised in health contexts (Carey and Lloyd, 1995). Researchers Mduma et al (2018) recently used SPC charts in labour wards and operating theatres at Haydom Lutheran Hospital in north-central Tanzania, to trace changes in perinatal mortality after a training program. The study, one of the first of its kind in a rural Sub-Saharan hospital, revealed a steady improvement in survival over time along with variations that could be linked to different interventions and events. As this example shows, SPC is a powerful tool to continuously monitor and describe changes in patient outcomes. SPC is “one of very few statistical methods that complete the hypothesis generation–hypothesis testing cycle of the scientific method, which is one reason for its popularity with practitioners. Practitioners have found that they learn new information from the charts, rather than just making a ‘yes/no’ decision.” (Mohammed, 2004, p. 244). It’s believed that the use of SPC would have identified the crimes of Harold Shipman as early as 1984, saving the lives of around 175 people (Spiegelhalter, 2019). SPC is not only able to provide methods for early detection of illegal behaviour, but also help to inform the quality of clinical care and maintain public trust (Aylin et al, 2003).
However, the human experience of health, illness and wellbeing is much more than biomedical findings and statistics, and cannot adequately be described by numbers or trends – “not everything that counts can be counted” (Cameron, 1963, p. 13). Indeed, the act of measurement itself can affect behaviour, particularly if people subject to the measurement are aware of it. The classic example of this is the “Cobra Effect”. Anecdotally, The British Colonial Government in Delhi, India implemented a bounty program to decrease the population of cobras. Initially successful in reducing the number of observed cobras, the scheme demonstrated a paradoxical effect over time: an increase in the presentation of dead cobras for the bounty was observed, not due to increased captures but due to entrepreneurial individuals breeding cobras to exploit the financial incentives. Recognizing this unintended consequence, government officials terminated the program, leading breeders to release the cobras into the wild, ultimately resulting in a higher cobra population in Delhi compared to pre-program levels (Hollins, 2017). In a similar vein there is Goodhart’s Law: When a measure becomes a target, it ceases to be a good measure, and the evolved version, Campbell’s Law: The more important a metric is in social decision making, the more likely it is to be manipulated. In health, these effects have been observed to have damaging implications in health research (Chong, 2021), healthcare service delivery (Poku, 2016) and waiting times for patients (Crawford, 2017). If we are to measure important things, we must be careful not to create perverse incentives by doing so.
Another aspect of quantitative data that must be treated with care is the difference between precision and accuracy; confusing the two can result in misinterpretation of the data. It is easy to believe that a very precise measure is more accurate than a less precise measure. In fact, there is no such correlation. Indeed, many articles refer to the reliability of a scale as its ‘‘precision,’’ and validity as its ‘‘accuracy’’, which is unhelpful and misleading (Streiner & Norman, 2006). Reliability is the ability of a measurement to obtain the same measure each time, whilst validity is the degree to which the method measures what you really want to measure (Spiegelhalter, 2019). An example of where validity may be misinterpreted is the Ecological Fallacy, or an “omitted-variables bias” (Kögel, 2017), where population level data is used to make erroneous assumptions about individual effects, a variety of which is Simpson’s Paradox. Simpson’s paradox is when a trend appears in several different groups of data but disappears or even reverses when groups are combined. Without careful statistical analysis and contextual understanding, quantitative data can disguise the truth, leading to disastrous consequences for public health. For example, during the early Covid-19 pandemic, early epidemiologic data showed that the case fatality rate was higher in Italy than in China. However, in analysing the data segmented by age, case fatality rates in China were higher compared to Italy across all age groups, because the distribution of cases across age groups differed significantly between the two countries (von Kügelgen et al, 2021).
Given the weaknesses demonstrated by quantitative methodologies, combining qualitative and quantitative methods can be powerful, and is the basis behind the mixed methods approach. The rationale of which is that through combining qualitative and quantitative methods in a multidisciplinary approach, one can utilise their respective strengths and escape their respective weaknesses (Tashakkori & Teddlie, 1998, from Lund, 2012).
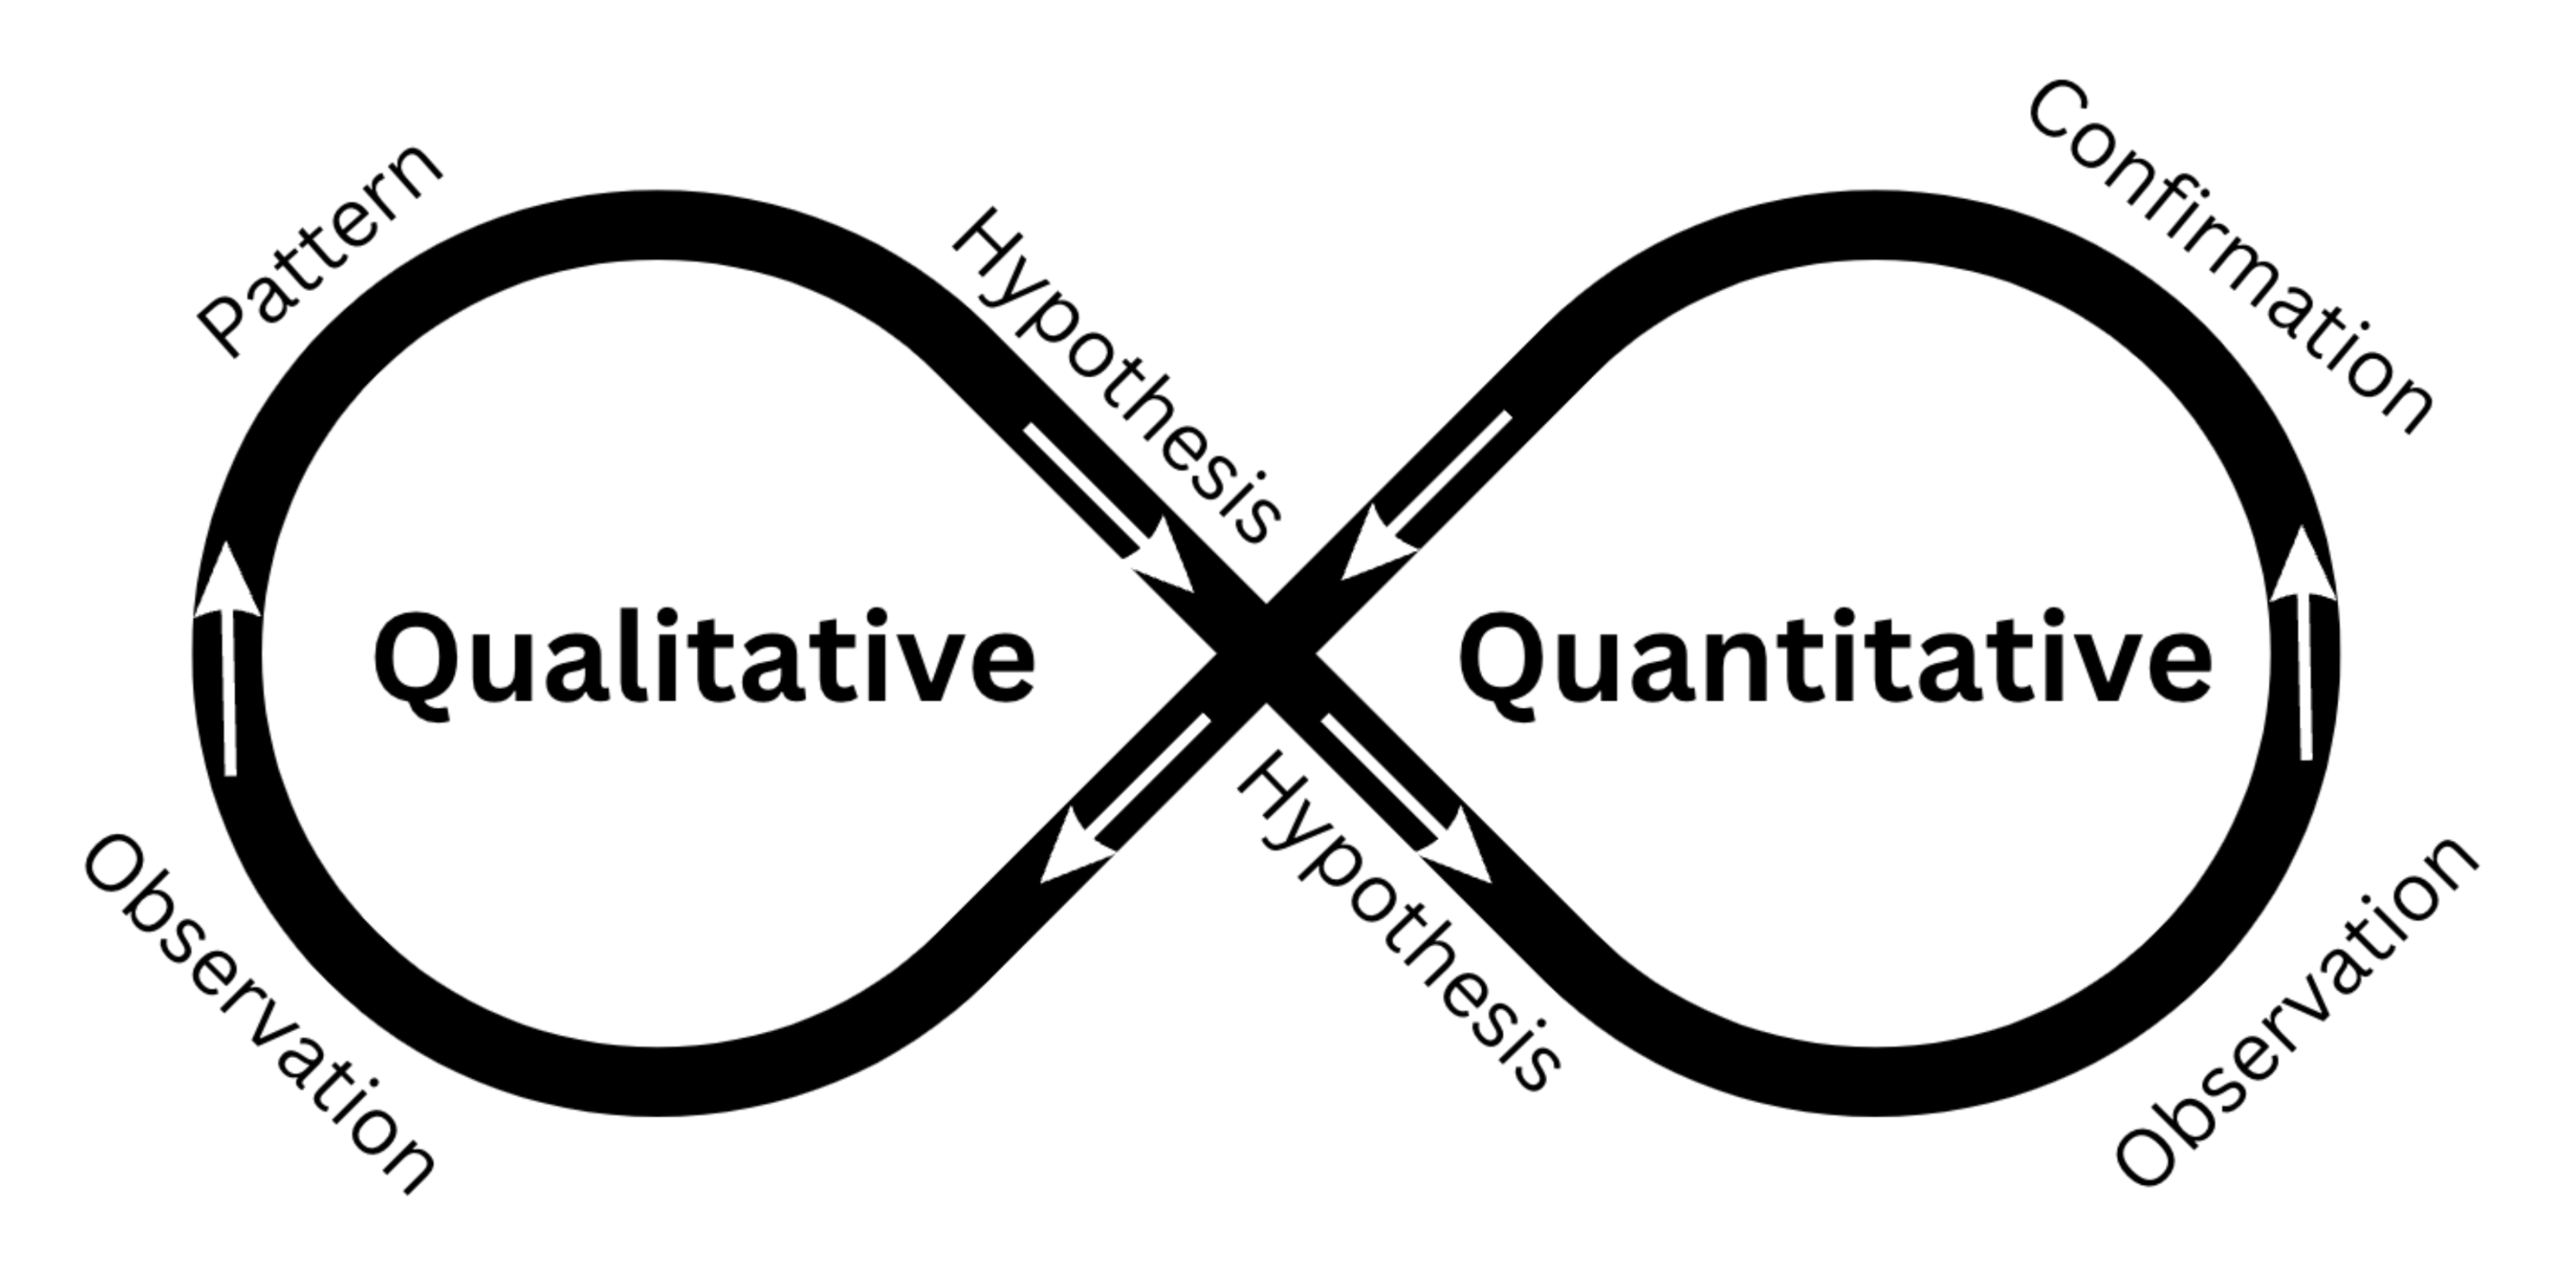
Figure 3: How Qualitative and Quantitative approaches can complement each other in a mixed methods approach.
As illustrated in my diagram above, the integration of quantitative and qualitative research methods enables a complementary approach to hypothesis generation, validation, and refutation. Qualitative methods allow researchers to observe and identify patterns that suggest a potential causal relationship between variables. Conversely, quantitative methods allow for the testing and verification or rejection of these causal links. Additionally, quantitative analyses may reveal correlations between variables, which can be further explored using qualitative methods to provide insights into the underlying mechanisms and reasons behind the observed associations (Schoonenboom & Johnson 2017). Combining both approaches allows the researcher to lend greater context to data: “Mixed-methods evaluations which integrate statistical methods with qualitative research methods are powerful… they allow [us] to peek into the black box.” (Alba et al, 2020, no page). A mixed methods approach is now recommended across the global health research field, from community health research (Andrew & Halcomb, 2007) to epidemiological studies (Lane-Fall, 2023). As demonstrated by the cellphone data in Wilson et al (2016) data in isolation only tells one story – that of population displacement – but when combined with qualitative approaches, the combined triangulated information is Aristotelian: the whole is greater than the sum of its parts.
The future holds opportunities to improve quantitative and qualitative approaches to research into global health. Increasing computing power and the ability to store massive datasets hold huge potential for quantitative research (Franklinos et al, 2022). Large Language Models (LLMs) already show promise in deductive coding (Xiao et al, 2023), analysis of massive datasets, the ability to rapidly generate statistical code and conduct rapid literature reviews (Sallam, 2023). LLM tools such as Remesh allow researchers to collect and process qualitative data faster and more easily. However, with that efficiency comes the danger of blind faith in the technology: trusting the outputs without question, potentially leading to worse research outcomes (Ellis & Reich, 2023) and poor public health decision making.
Emergent (at least in global health) practices such as SPC are likely to change the way global health research is conducted in the future. The trend towards mixed methods will continue, enhanced by the capabilities of LLMs, big data and cloud computing. It is clear that quantitative methods have their strengths, but also weaknesses. Applying both quantitative and qualitative approaches in mixed methods studies has the potential to allow researchers to utilise both their strengths and mitigate their respective weaknesses.
Word count: 2994.
References:
Alba, S. Baatsen, P. Blok, L. Toonen, J. (2020) Not everything that counts can be counted: mixed methods impact evaluations in global health – BMJ Global Health blog, BMJ Global Health blog. Available at: https://blogs.bmj.com/bmjgh/2020/05/11/not-everything-that-counts-can-be-counted-mixed-methods-impact-evaluations-in-global-health/ (Accessed: 12 June 2023).
Ahmed, Ishtiaq & Ishtiaq, Sundas. (2021). Reliability and validity Importance in Medical Research. Journal of the Pakistan Medical Association. 71. 2403. 10.47391/JPMA.06-861.
American Society for Quality (ASQ). About: Walter A. Shewhart. Available at http://www.asq.org/about/ history/shewhart, html.
2000.(Accessed: 9 June 2023).
Andrew, S., & Halcomb, E. J. (2007). Mixed methods research is an effective method of enquiry for community health research. Contemporary nurse, 23(2), 145-153.
Aylin, P., Best, N., Bottle, A., & Marshall, C. (2003). Following Shipman: a pilot system for monitoring mortality rates in primary care. The Lancet, 362(9382), 485-491.
Bokai WANG, C. (2018) “Simpson’s Paradox: Examples”, Shanghai Archives of Psychiatry, 30(2), p. 139. Available at: https://www.ncbi.nlm.nih.gov/pmc/articles/PMC5936043/ (Accessed: 12 June 2023).
Brooks, C. 2015. More Ebola in Guinea, Sierra Leone last week, no Liberia cases says WHO | GNN Liberia (2015). Available at: https://web.archive.org/web/20150402093450/http://www.gnnliberia.com/articles/2015/03/05/more-ebola-guinea-sierra-leone-last-week-no-liberia-cases-says-who (Accessed: 8 June 2023).
Bryman, A. (2016). Social research methods. Oxford university press.
Cairo, A. (2016). The Truthful Art: Data, Charts, and Maps for Communication. United Kingdom: New Riders.
Cameron, W B. (1963). Informal Sociology: A Casual Introduction to Sociological Thinking. Studies in Sociology – Random House. Volume 21 of Studies in sociology, ISSN 0562-3979
Carey, R, Lloyd R. (1995), Measuring Quality Improvement in Healthcare: A Guide to Statistical Process Control Applications. Quality Press.
Centers for Disease Control and Prevention, (2017). 2014 Ebola Outbreak in West Africa Epidemic Curves. Available at: https://www.cdc.gov/vhf/ebola/history/2014-2016-outbreak/cumulative-cases-graphs.html (Accessed: 8 June 2023).
Chong, S. E. (2021). Campbell’s Law: Implication in Medical Publications and Clinical Sciences. Journal of Biomedical and Clinical Sciences (JBCS), 6(2), 45-48.
Corry, L. (1989). Linearity and reflexivity in the growth of mathematical knowledge. Science in Context, 3(2), 409-440.
Crawford, S. M. (2017). Goodhart’s law: when waiting times became a target, they stopped being a good measure. BMJ, 359.
Demographic and Health Survey (2011) Nepal Demographic and Health Survey 2011, Ministry of Health and Population. Available at: https://dhsprogram.com/pubs/pdf/FR257/FR257[13April2012].pdf, Accessed 9.12.2015.
Ellis, G. Reich, Q. (2023) How Large Language Models (LLMs) are Shaping the Research Industry: Benefits, Limitations, and Risks, Blog.remesh.ai. Available at: https://blog.remesh.ai/how-large-language-models-llm-are-shaping-the-research-industry-benefits-limitations-risks (Accessed: 12 June 2023).
Fisher, B. Mutt & Jeff Florence Morning News, 3 June 1942, p. 7
Franklinos, L., Parrish, R., Burns, R., Caflisch, A., Mallick, B., Rahman, T., … & Trigwell, R. (2022). Key opportunities and challenges for the use of big data in migration research and policy. UCL Open Environment, 3.
Hollins, M. 2017. Curbing the Cobra effect. Insight, The Financial Conduct Authority. Available at: https://www.fca.org.uk/insight/curbing-cobra-effect (Accessed: 12 June 2023).
Kazoleas, D. C. (1993). A comparison of the persuasive effectiveness of qualitative versus quantitative evidence: A test of explanatory hypotheses. Communication Quarterly, 41(1), 40-50.
Kögel, Tomas. (2017). Simpson’s paradox and the ecological fallacy are not essentially the same: The example of the fertility and female employment puzzle.
Lane-Fall, M. B. (2023). Why Epidemiology Is Incomplete Without Qualitative and Mixed Methods. American Journal of Epidemiology, 192(6), 853-855.
Lund, T., 2012. Combining qualitative and quantitative approaches: Some arguments for mixed methods research. Scandinavian journal of educational research, 56(2), pp.155-165.
Mason, J. (2002) Qualitative Researching. 2nd Edition, Sage Publications, London.
McInnes, C. (2016). Crisis! What crisis? Global health and the 2014–15 west African Ebola outbreak. Third World Quarterly, 37(3), 380-400.
Mduma, E. R., Ersdal, H., Kvaloy, J. T., Svensen, E., Mdoe, P., Perlman, J., … & Soreide, E. (2018). Using statistical process control methods to trace small changes in perinatal mortality after a training program in a low-resource setting. International Journal for Quality in Health Care, 30(4), 271-275.
Merson M. H. Black R. E. & Mills A. J. (2012). Global health : diseases programs systems and policies (3rd ed.). Jones & Bartlett Learning.
Mohammed, M. A. (2004). Using statistical process control to improve the quality of health care. BMJ Quality & Safety, 13(4), 243-245.
Muller, J. (2018). The tyranny of metrics. Princeton University Press.
Nash, K., Trott, V., & Allen, W. (2022). The politics of data visualisation and policy making. Convergence, 28(1), 3-12.
Park, D.J., Dudas, G., Wohl, S., Goba, A., Whitmer, S.L., Andersen, K.G., Sealfon, R.S., Ladner, J.T., Kugelman, J.R., Matranga, C.B. and Winnicki, S.M., (2015). Ebola virus epidemiology, transmission, and evolution during seven months in Sierra Leone. Cell, 161(7), pp.1516-1526.
Park, Y. S., Konge, L., & Artino, A. R. (2020). The positivism paradigm of research. Academic Medicine, 95(5), 690-694.
Porter, T. M., & Haggerty, K. D. (1997). Trust in numbers: the pursuit of objectivity in science & public life. Canadian Journal of Sociology, 22(2), 279.
Poku, M. (2016). Campbell’s law: implications for health care. Journal of health services research & policy, 21(2), 137-139.
Richards, P., Amara, J., Ferme, M.C., Kamara, P., Mokuwa, E., Sheriff, A.I., Suluku, R. and Voors, M., (2015). Social pathways for Ebola virus disease in rural Sierra Leone, and some implications for containment. PLoS Negl Trop Dis, 9(4), p.e0003567.
Sallam, M. (2023). The utility of ChatGPT as an example of large language models in healthcare education, research and practice: Systematic review on the future perspectives and potential limitations. medRxiv, 2023-02.
Schoonenboom, J., & Johnson, R. B. (2017). How to construct a mixed methods research design. Kolner Zeitschrift fur Soziologie und Sozialpsychologie, 69(Suppl 2), 107.
Seland, D. (2021) A Brief History of Statistical Process Control. Quality Magazine (2023). Available at: https://www.qualitymag.com/articles/96349-a-brief-history-of-statistical-process-control (Accessed: 9 June 2023).
Spiegelhalter, D. (2019). The Art of Statistics: Learning from Data. United Kingdom: Penguin Books Limited.
Streiner, D. L., & Norman, G. R. (2006). “Precision” and “accuracy”: two terms that are neither. Journal of clinical epidemiology, 59(4), 327-330.
Tashakkori, A. and Teddlie, C., 1998. Mixed methodology: Combining qualitative and quantitative approaches (Vol. 46). Sage.
Tennant, G. (2001) Six Sigma: SPC and TQM in Manufacturing and Services. Routledge. doi: 10.4324/9781315243023.
Theerthaana, P., & Arun, C. J. (2021). Did double lockdown strategy backfire? Cobra effect on containment strategy of COVID-19. International Journal of Disaster Risk Reduction, 65, 102523.
Topp, S.M., Scott, K., Ruano, A.L. and Daniels, K., (2018). Showcasing the contribution of social sciences to health policy and systems research. Int J Equity Health 17, 145
Trafton, J. G., & Triantafyllou, A. C. (2023). Understanding the Quality and Credibility of Information Retrieved From Large Language Models: A Systematic Review. Frontiers in Big Data, 6.
Trautmann, F. & Burrows, D., (1999). Conditions for the effective use of rapid assessment and response methods, Marrickville: International Journal of Drug Policy.
Topp, S.M., Scott, K., Ruano, A.L. and Daniels, K., (2018). Showcasing the contribution of social sciences to health policy and systems research. Int J Equity Health 17, 145
von Kügelgen, J., Gresele, L., & Schölkopf, B. (2021). Simpson’s paradox in Covid-19 case fatality rates: a mediation analysis of age-related causal effects. IEEE Transactions on Artificial Intelligence, 2(1), 18-27.
West of England Academic Health Science Network (WEAHN). (No date) Statistical Process Control (SPC) Charts – . Available at: https://www.weahsn.net/toolkits-and-resources/quality-improvement-tools-2/more-quality-improvement-tools/statistical-process-control-spc-charts/ (Accessed: 9 June 2023).
Wilson, R., zu Erbach-Schoenberg, E., Albert, M., Power, D., Tudge, S., Gonzalez, M., Guthrie, S., Chamberlain, H., Brooks, C., Hughes, C. and Pitonakova, L., (2016). Rapid and near real-time assessments of population displacement using mobile phone data following disasters: the 2015 Nepal Earthquake. PLoS currents, 8.
World Bank. GNI per capita, Atlas method (current US $). World Bank Open Data (2023). Available at: https://data.worldbank.org/indicator/ny.gnp.pcap.cd?most_recent_value_desc=true&year_high_desc=true (Accessed: 15 May 2023).
Wulfman, C. E. (2014). The Plot of the Plot: Graphs and Visualizations. The Journal of Modern Periodical Studies, 5(1), 94-109.
Xiao, Z., Yuan, X., Liao, Q. V., Abdelghani, R., & Oudeyer, P. Y. (2023). Supporting Qualitative Analysis with Large Language Models: Combining Codebook with GPT-3 for Deductive Coding. In Companion Proceedings of the 28th International Conference on Intelligent User Interfaces (pp. 75-78).
Yabe, T., Tsubouchi, K., Fujiwara, N., Sekimoto, Y., & Ukkusuri, S. V. (2020). Understanding post-disaster population recovery patterns. Journal of the Royal Society interface, 17(163), 20190532.