The 2023 State of Devops Report – Summary

The 2023 “Accelerate State of DevOps Report” has provided several substantial insights. Here are the four main takeaways, delved into with more detail:

Burnout and the Underrepresented:

The report has identified a worrying link: there’s a correlation between the quality of documentation work and increased burnout, especially among those who identify as underrepresented. The data suggests that these individuals might be taking on a significant portion of such tasks. Businesses need to re-evaluate work distribution mechanisms to ensure fairness and avoid undue stress on specific teams or individuals.

The Significance of Documentation:

The report doesn’t just highlight documentation as a task but underscores its pivotal role in organizational success. Effective documentation directly influences technical capabilities, team productivity, and overall performance. Businesses aiming to elevate their documentation practices can refer to resources like the Society for Technical Communications and Google’s technical writing courses. Investing time and resources in documentation isn’t just beneficial—it’s essential.

A Glimpse into Google’s SRE Approach:

As Google’s suite of products grew, there was a pressing need to scale their Site Reliability Engineering (SRE) roles. The challenge was to do so without compromising on efficiency or reliability. The report sheds light on how Google has evolved its SRE practices to meet this challenge, offering valuable lessons for businesses grappling with scalability issues.

Harnessing the Power of Cloud Computing:

The report makes it clear: it’s not just about using cloud computing, but how you use it that counts. Businesses that strategically harness flexible infrastructure see improvements across various performance metrics. Moreover, the report lists the essential characteristics of effective cloud computing, acting as a guide for organizations to maximize their cloud benefits.

 

Leadership vs Management

management and leadership

Or is it Leadership *and* Management?


Tom Geraghty
Speaking at CIO Event in London, 2019

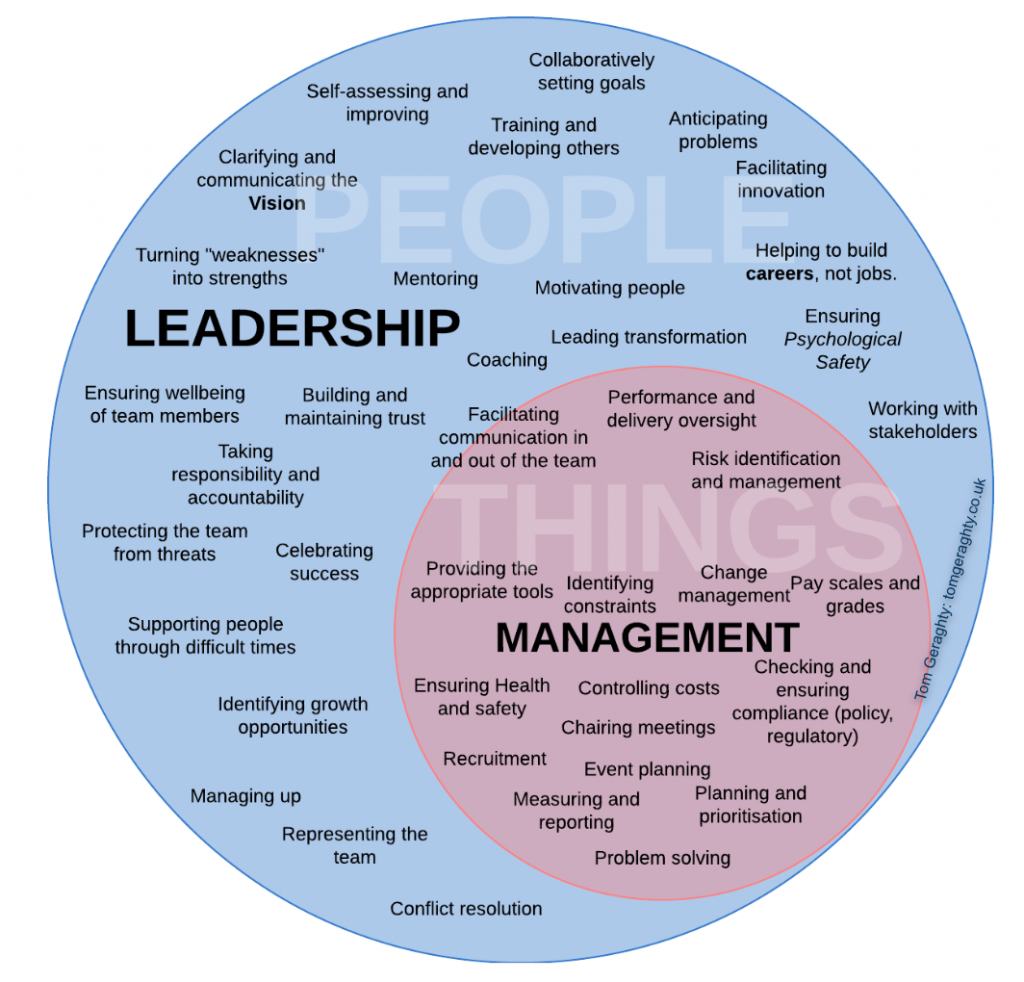
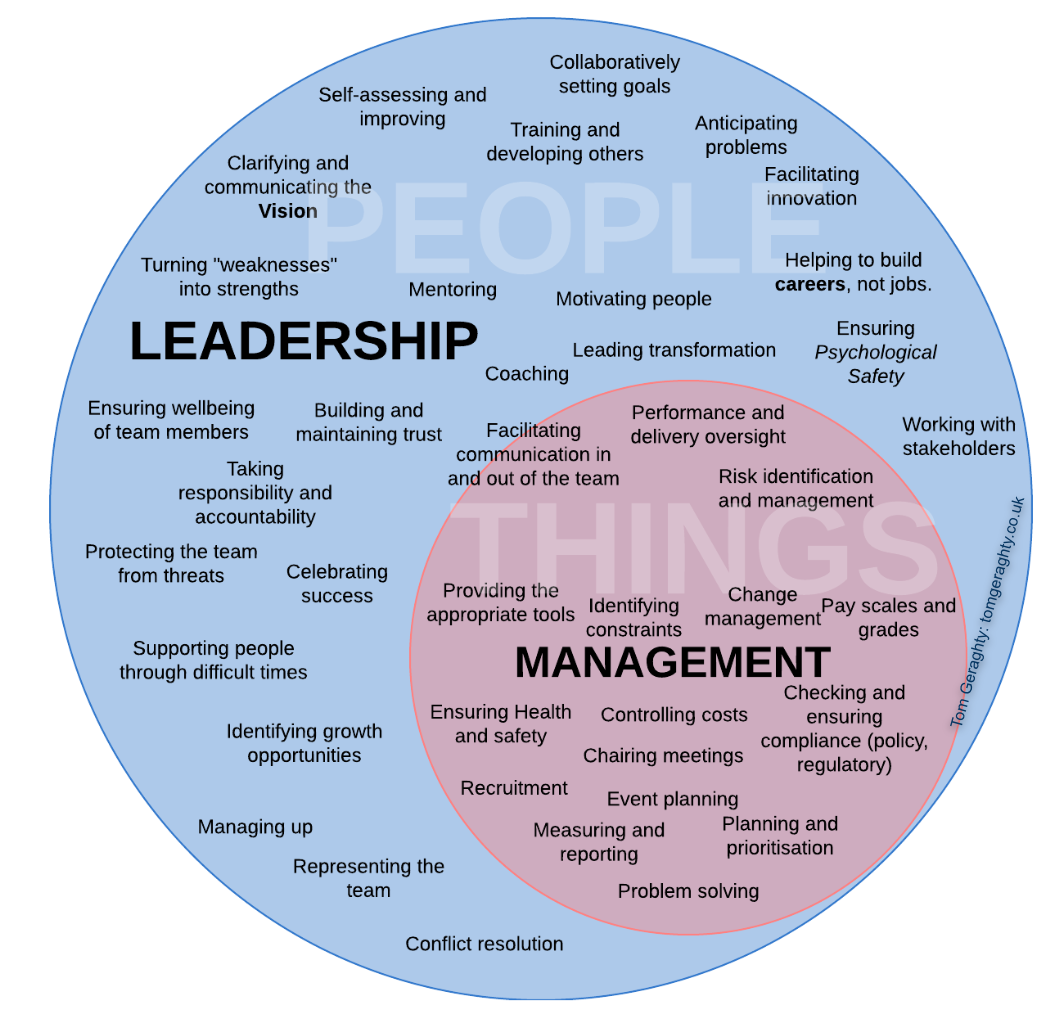
I created this graphic in 2019 as part of a presentation on High Performing Teams for the IT Leaders Conference.

management and leadership

Inspired by Grace Hopper’s “You manage things, you lead people” quote, I wanted to make the point that great leadership also requires great management skills. You can be a great manager of things without leadership skills, but you can’t be a great leader without good management skills. Without those management skills, you may be able to lead people, but your lack of direction, effectiveness, and capability could lead to failure.

You manage things, you lead people" quote by grace hopper

Sometimes management and leadership are presented as a binary, or worse, that “management” is bad and “leadership” is good. Neither is true: we should resist “leaderism“, and instead concentrate on the actual capabilities and skills required to manage things, and lead people. Both can be learned, taught, and always improved. We dive into this much deeper over at psychsafety.com, where we examine the capabilities and skills required for both excellent management and leadership.

tom geraghty psychological safety

(Since 2019, this graphic has gone a bit viral on LinkedIn, Chegg, Twitter and elsewhere!)

The fabulous Elita Silva translated the management and leadership graphic into Portuguese!

management and leadership - Portuguese


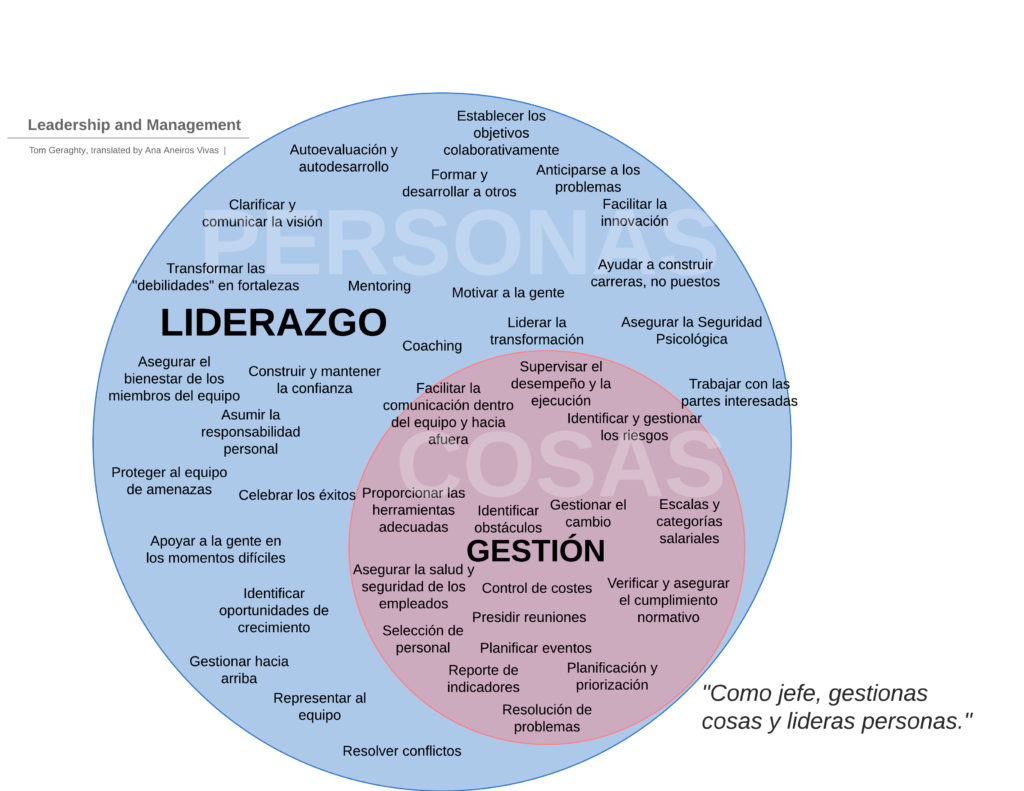
And the fabulous Ana Aneiros Vivas has translated it into Spanish!

Spanish-version-of-Management-and-leadership

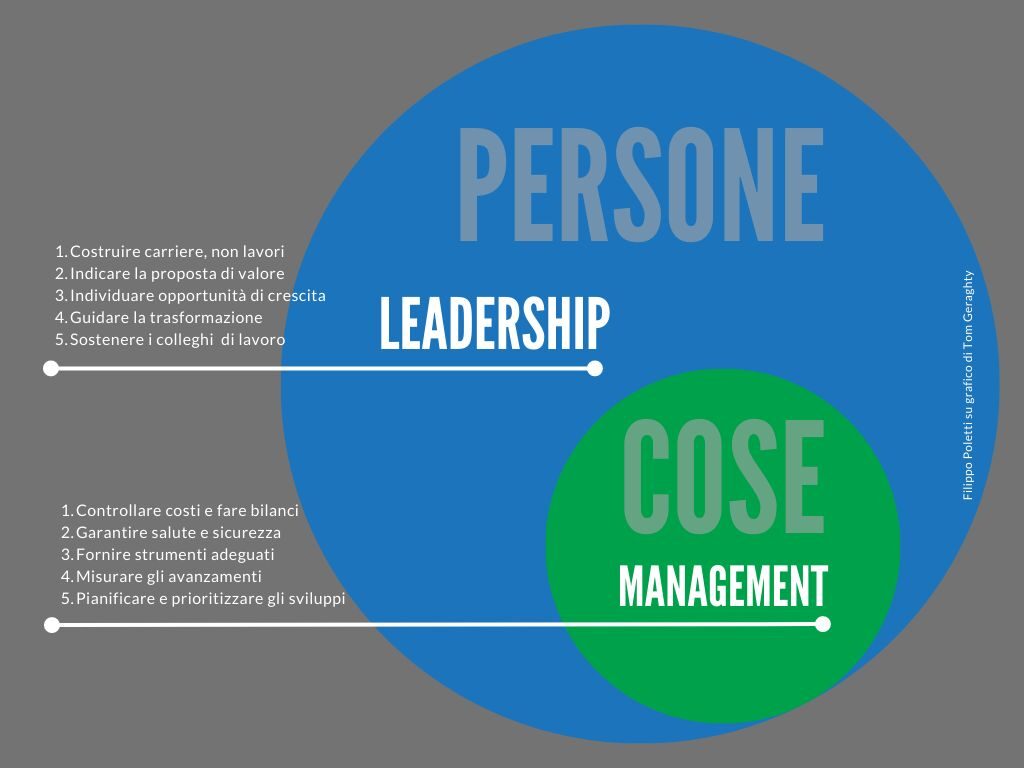
Filippo Poletti translated it into Italian!

management and leadership in Italian


And the folk at Solutions and Performances – Executive Search have translated it into French!

SLAM Teams, or SLLLAM teams?

PepsiCo coined the term “SLAM” teams as a way to address teaming in large, complex organisations. SLAM teams are:

  • Self-organising
  • Lean
  • Autonomous
  • Multidisciplinary

These characteristics combine to foster agility, alignment, collaboration, and speed. Despite a large organisational size, this enables people  to act more like a network of small, tightly-knit teams. By organising around the work to be done, rather than the lines and boxes of an org chart, teams avoid becoming siloed and disconnected from value. These terms are usually associated with software delivery or engineering teams, and the concepts are part of the DevOps cultures and practices in general, but SLAM teams are appropriate for use in many domains from engineering to healthcare, and education to armed forces.

The people closest to the problem have the best information necessary to accomplish the task. A self-organising team has the freedom to decide how the work gets done and who completes which tasks. The manager exists as a coach and guide, not as a dictator.

There’s a limit to the amount of information we can store in our mind and the limitations of our working memory make it difficult to manage the complexities and communication overhead of large groups. Working in large groups slows us down, subjects us to greater decision fatigue and often impedes our ability to build psychological safety and carry out experiments. A Lean team is limited in size to 7-9 members, reducing communication complexity and improving decision capability.

Autonomous teams move quickly. We enable autonomy and reduce the number of external dependencies by clarifying what decisions can be made by the team members.

Having all the skills required in the team to make decisions and carry out the work from start to finish is the key point behind cross-functional, multi-disciplinary teams. If the team need to go outside the group to ask for decision support or worse, execution help, the pace of work slows down dramatically and the ability of the team to support the product also diminishes.

However, I’ve always felt there were some key points missing from SLAM teams. A key element of high performing teams is how long they exist for. Sure, we can have high performing teams that form and disperse over short timescales, but it’s harder, becomes very tiring over longer periods of time, and short-lived teams will never reach the very high performance that a long-lived team will do. So how about we make some tweaks?

  • Self-organising
  • Lean
  • Long-Lived
  • Autonomous
  • Multidisciplinary

SLLLAM teams not only self-organise, make their own decisions, and possess only the required team members with the right skills, but exist for a long time. The products we build should exist for a long time (or as long as is required), and the team should exist for at least as long as the product exists.

180 Factors of Organisational and Digital Transformation

The below is a simple but extensive (though non-exhaustive and growing) list of factors to address and discover when working on organisational and digital transformations.

I’ve used this list as a helpful reminder when carrying out discovery sessions with clients, and you can too! If you’d like to suggest additions or changes, please let me know!

Organisation

  • Line of business
  • Risk register / immediate risks
  • Risk appetite
  • Public / private / shareholding / equity holding
  • Impediments and current challenge
  • Tracking up or tracking down
  • Industry volatility and disruption
  • Competitors
  • Urgency
  • Cost of delays
  • Cost of changes
  • Regulatory compliance needs
  • Locations
  • Time zones
  • Organisation size
  • Organisation age
  • Diversity of business lines/units
  • Purpose and values
  • Mission statement
  • History and folklore
  • Past mergers and acquisitions
  • Organisation identity in the world
  • Public or private
  • Short term pressure / long term pressure
  • Heterogeneity of leadership / board
  • Finances – cash, P&L, share price, turnover, EBITDA
  • Cost sensitivity
  • Preference for opex vs capex
  • Exit strategy


People

  • Organisational culture
  • Heterogeneity of culture across the organisation
  • Leadership buy-in to transformation
  • Key stakeholders
  • Prior transformation attempts
  • Psychological safety (org-wide / in-team)
  • Customer expectations
  • Customer base (business, consumer, public, other)
  • Ease of customer feedback
  • Diversity
  • Equality, gender pay gap visibility
  • National identity and culture
  • Survival anxiety
  • Team member churn rate / length of tenure
  • Organisational structure, reporting lines, matrix, hierarchies
  • Geographical distribution
  • Permanent teams vs outsourced teams
  • Skill and mastery level
  • Tacit knowledge in the organisation
  • Capabilities and gaps
  • Promotions, recognitions and awards
  • Pay scales
  • Orthodoxies
  • Defined roles
  • Cross-teaming
  • Training, coaching, mentoring, support
  • Career paths
  • Physical working environment
  • Communities of Practice
  • Remote vs on-prem (degrees of remoteness)
  • Longevity of teams
  • Centres of Excellence / Enablement
  • Stream aligned teams / function-aligned teams / hybrid
  • Known rituals
  • Facilities, office design, open vs closed offices, physical space
  • Exposure to “business” information such as cashflow, profit, turnover, and granularity.


Process

  • Operating model
  • Policies
  • Standards
  • Processes
  • Regulation of process
  • Standardisation appetite
  • Finance process
  • Budget cycle
  • Business case requirement
  • Hiring process
  • Procurement process and duration
  • Adherence to frameworks
  • International & national standards
  • Audit frequency and type
  • Governance, risk, compliance processes
  • Product vs project
  • ITIL / COBIT / other frameworks
  • Environment provisioning
  • Preference for waterfall vs agile
  • Handoffs
  • WIP limits
  • Communications cadences and expectations
  • Current methodologies and practices
  • Security clearances
  • Natural / habitual cadences
  • Agile adoption
  • Scrum adoption
  • Methodologies at scale (SAFe, LESS, etc)
  • Statistical Process Control – level of automation and adoption


Data and Tools

  • Wall space or digital tools – information radiators
  • Data-driven insights capability
  • Communication tools – asynchronous vs synchronous
  • Silos of information
  • Data feedback loops
  • Dataviz and analytic tools
  • Degree of tool integration
  • SSO
  • “Shadow” IT
  • Degree of autonomy / lockdown of machines
  • AI/ML
  • Volume of data
  • Information availability, default to open/closed
  • Data treated as asset or liability
  • Default information openness
  • Dashboarding and reporting


Products

  • Number and characteristics of key products
  • Criticality (life/death or just for fun)
  • Cost of delay for features
  • Level of planning expectation
  • Estimates and deadlines required
  • Risk appetite
  • Reliability requirements
  • Scaling requirements
  • Quality requirements
  • Degree of coupling
  • Degree of cohesion
  • Current lead time
  • Current flow / wait time
  • Current quality
  • Internal regulation
  • Unplanned vs planned work
  • Product lifespan
  • Feature lifespan
  • Marketing approach and capabilities


Technology

  • Satisfaction of technical capability
  • Common platform?
  • Architecture – monolithic vs microservices / APIs
  • Potential fracture planes
  • Team topology
  • Corporate network (MPLS, VPNs, hybrid, SDN, etc)
  • Cloud usage (production) – private/hybrid/public
  • Edge and IoT technology
  • Preferred technologies and codebase
  • Build and Deployment pipelines
  • Deployment strategies – canary, blue/green, rolling, A/B
  • Engineering skills
  • Engineering practices
  • Service Desk?
  • Infra as code
  • Containerisation
  • Test and QA approach
  • Work definition approach – user stories, MoSCoW etc
  • Rate, predictability and volume of work requests
  • Where does work come from?
  • Environments
  • Monitoring and observability
  • Degree of automation
  • Branching strategies
  • Existing reliability
  • Existing rate of change
  • Accelerate metrics
  • Technical debt
  • Pair programming, mob programming practices
  • Ratio of junior to senior engineers
  • Dev workstations and tooling
  • Dev / Ops teams & handovers
  • On-call culture and process
  • Infosec team / function and interactions

Please feel free to use this however you’d like, and if you think something needs adding to this list of organisational transformation factors, please let me know!

Summary of all State of DevOps Reports since 2013

It’s not that easy to find all the annual state of DevOps reports, partly because they forked in 2017 between Puppet and Google/DORA. Below I’ve listed each report by year, and I’m in the process of listing all the key findings from each report. Some reports provide greater insights than others.

The first report was in 2013, and showed quite clearly that adopting DevOps practices resulted in technological and business improvements. Along the way, Puppet and Google / DORA joined forces, parted ways, and now (as of writing in 2021) there are two State of DevOps Reports, and the focus has broadened to SRE, Organisational Culture, Security, and even Documentation.

2013 – Puppet:

  1. Respondents from organisations that implemented DevOps reported improved software deployment quality and more frequent software releases.
  2. DevOps enables high performance by increasing agility and reliability. High performing organisations ship code 30x faster and complete those deployments 8,000 times faster than their peers. They also have 50% fewer failures and restore service 12 times faster than their peers.
  3. Organisations that have implemented DevOps practices are up to five times more likely to be high-performing than those that have not. In fact, the longer organisations have been using DevOps practices, the better their performance: The best are getting better.

2014 – Puppet and DORA –

  1. Strong IT performance is a competitive advantage. Firms with high-performing IT organisations were twice as likely to exceed their profitability, market share and productivity goals.
  2. DevOps practices improve IT performance. IT performance strongly correlates with well-known DevOps practices such as use of version control and continuous delivery.
  3. Organizational culture matters. Organizational culture is one of the strongest predictors of both IT performance and overall performance of the organisation. High-trust organisations encourage good information flow, cross-functional collaboration, shared responsibilities, learning from failures and new ideas; they are also the most likely to perform at a high level.
  4. Job satisfaction is the No. 1 predictor of organisational performance. Job satisfaction includes doing work that’s challenging and meaningful, and being empowered to exercise skills and judgment. Where there is job satisfaction, employees bring the best of themselves to work: their engagement, their creativity and their strongest thinking.

2015 – Puppet and DORA:

  1. High-performing IT organisations deploy 30x more frequently with 200x shorter lead times; they have 60x fewer failures and recover 168x faster. Failures are unavoidable, but how quickly you detect and recover from failure can mean the difference between leading the market and struggling to catch up with the competition.
  2. Lean management and continuous delivery practices create the conditions for delivering value faster, sustainably.  This results in higher quality, shorter cycle times with quicker feedback loops, and lower costs. These practices also contribute to creating a culture of learning and continuous improvement.
  3. High performance is achievable whether your apps are greenfield, brownfield or legacy. As long as systems are architected with testability and deployability in mind, high performance is achievable.
  4. IT managers play a critical role in any DevOps transformation. Managers can do a lot to improve their team’s performance by ensuring work is not wasted
    and by investing in developing the capabilities of their people.
  5. Diversity matters. Research shows that teams with more women members have higher collective intelligence and achieve better business outcomes.
  6. Deployment pain can tell you a lot about your IT performance. Where code deployments are most painful, you’ll find the poorest IT performance, organisational performance and culture.
  7. Burnout can be prevented, and DevOps can help. Burnout is associated with pathological cultures and unproductive, wasteful work.

2016 – Puppet and DORA:

  1. High-performing organisations are decisively outperforming their lower-performing peers in terms of throughput. High performers deploy 200 times more frequently than low performers, with 2,555 times faster lead times. They also continue to significantly outperform low performers, with 24 times faster recovery times and three times lower change failure rates.
  2. High performers have better employee loyalty, as measured by employee Net Promoter Score (eNPS). Employees in high-performing organisations were 2.2 times more likely to recommend their organisation to a friend as a great place to work, and 1.8 times more likely to recommend their team to a friend as a great working environment. Other studies have shown that this is correlated with better business outcomes.
  3. Improving quality is everyone’s job. High-performing organisations spend 22 percent less time on unplanned work and rework. As a result, they are able to spend 29 percent more time on new work, such as new features or code. They are able to do this because they build quality into each stage of the development process through the use of continuous delivery practices, instead of retrofitting quality at the end of a development cycle.
  4. High performers spend 50 percent less time remediating security issues than low performers. Through better integrating information security objectives into daily work, teams achieve higher levels of IT performance and build more secure systems. less time on unplanned work and rework.
  5. Taking an experimental approach to product development can improve your IT and organisational performance. The product development cycle starts long before a developer starts coding. Your product team’s ability to decompose products and features into small batches; provide visibility into the flow of work from idea to production; and gather customer feedback to iterate and improve will predict both IT performance and deployment pain.

2017 – Puppet and DORA:

  1. Transformational leaders share five common characteristics that significantly shape an organisation’s culture and practices, leading to high performance. The characteristics of transformational leadership — vision, inspirational communication, intellectual stimulation, supportive leadership, and personal recognition — are highly correlated with IT performance.
  2. High-performing teams continue to achieve both faster throughput and better stability. The gap between high and low performers narrowed for throughput measures, as low performers reported improved deployment frequency and lead time for changes, compared to last year. However, the low performers reported slower recovery times and higher failure rates. It’s possible that pressure to deploy faster and more often causes lower performers to pay insufficient attention to building in quality.
  3. Automation is a huge boon to organisations. High performers automate significantly more of their configuration management, testing, deployments and change approval processes than other teams. The result is more time for innovation and a faster feedback cycle.
  4. Loosely coupled architectures and teams are the strongest predictor of continuous delivery. If you want to achieve higher IT performance, start shifting to loosely coupled services — services that can be developed and released independently of each other — and loosely coupled teams, which are empowered to make changes.
  5. Lean product management drives higher organisational performance. Lean product management practices help teams ship features that customers actually want, more frequently. This faster delivery cycle lets teams experiment, creating a feedback loop with customers.

2018 – Puppet:

  1. DevOps drives business growth – maintaining a robust software delivery and operability function increases productivity, profitability, and market share.
  2. Cloud technology correlates with business performance – this is enabled by reliable and sustainable cloud infrastructure, utilised via cloud native patterns.
  3. Open source software improves performance – high-performing IT teams are 1.75 times more likely to use open-source applications.
  4. Functional outsourcing can be detrimental to software performance, and Elite Performers are rarely using it.
  5. Technical practices such as monitoring and observability, continuous testing, database change management, and the early integration of security in software development all enable organisational performance.
  6. DORA identified high-performing organisations in a range of profit, not-for-profit, regulated, and non-regulated industries. The industry you’re in doesn’t affect your ability to perform.
  7. Diversity in tech is poor, but improving, and teams with improved diversity demonstrate higher performance than those that don’t.

2018 – DORA  (Accelerate):

  1. SDO (Software Delivery Organisation – i.e. development teams) performance unlocks competitive advantages. Those include increased profitability, productivity, market share, customer satisfaction, and the ability to achieve organisation and mission goals.
  2. How you implement cloud infrastructure matters. Proper (effective) usage of the public cloud improves software delivery performance and teams that leverage all of cloud computing’s essential characteristics are 23 times more likely to be high performers.
  3. Open source software improves performance. Open source software is 1.75 times more likely to be extensively used by the highest performers.
  4. Outsourcing by function is rarely adopted by elite performers and hurts performance. While outsourcing can save money, low-performing teams are almost 4 times as likely to outsource whole functions such as testing or operations than their highest-performing counterparts.
  5. Key technical practices drive high performance. These include monitoring and observability, continuous testing, database change management, and integrating security earlier in the SDLC.
  6. Industry doesn’t matter when it comes to achieving high performance for software delivery. High performers exist in both non-regulated and highly regulated industries alike.

2019 – Puppet:

  1. Doing DevOps well enables you to do security well.
  2. Integrating security deeply into the software delivery lifecycle makes teams more than twice as confident of their security posture.
  3. Integrating security throughout the software delivery lifecycle leads to positive outcomes.
  4. Security integration is messy, especially in the middle stages of evolution.

2019 – Google:

  1. The industry continues to improve, particularly among the elite performers.
  2. The best strategies for scaling DevOps in organisations focus on structural solutions that build community, including Communities of Practice.
  3. Cloud continues to be a differentiator for elite performers and drives high performance.
  4. To support productivity, organisations can foster a culture of psychological safety and make smart investments in tooling, information search, and reducing technical debt through flexible, extensible, and viewable systems.
  5. Heavyweight change approval processes, such as change approval boards, negatively impact speed and stability. In contrast, having a clearly understood process for changes drives speed and stability, as well as reductions in burnout.

2020 – Puppet:

  1. The industry still has a long way to go and there remain significant areas for improvement across all sectors.
  2. Internal platforms and platform teams are a key enabler of performance, and more organisations are adopting this approach.
  3. Adopting a product approach over project-oriented improves performance and facilitates improved adoption of DevOps cultures and practices.
  4. Lean, automated, and people-oriented change management processes improve velocity and performance.

2021 – Puppet:

  1. Organisational dynamics must be considered crucial to transformation.
  2. Cloud-native approaches are critical. It is no good to simply move traditional workloads to the cloud.
  3. Shift security, compliance and change governance left, and include security stakeholders in all stages of value delivery.
  4. Culture change is key, and must be promoted from the very “top” as well as delivered from the “bottom”. Psychological safety is at the core of digital and cultural transformations.

2021 – Accelerate:

  1. The “highest performers” continue to improve the velocity of delivery.
  2. Adoption of SRE practices improves wider organisational performance.
  3. Adoption of cloud technology accelerates software delivery and organisational performance. Multi-cloud adoption is also on the increase.
  4. Secure Software Supply Chains enable teams to deliver secure software quickly, safely and reliably.
  5. Documentation is important to being able to implement technical practices, make changes, and recover from incidents. 
  6. Inclusive and generative team cultures improve resilience and performance.

2022 – Google / DORA:

  1. Generative Cultures are indicators of higher performance.
  2. Less experienced teams who implemented trunk-based development actually show less positive results than teams who do not use trunk-based development.
  3. Healthy, high-performing teams also tend to have good security practices broadly established.
  4. Software delivery performance alone does not predict organisational success. Excellent software delivery combined with high reliability (high DORA Metrics in this case) correlate with organisational success.